文本、箭头和注释
阅读: 4790 评论:2很多时候,光是图像不足以表达所有的内容,需要一些说明性的文字来辅助。
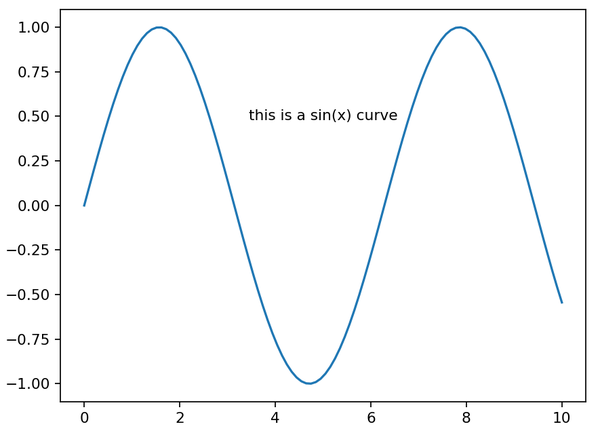
在Matplotlib中,使用plt.text方法为图例添加文字。
x = np.linspace(0,10,100)
plt.plot(x, np.sin(x))
plt.text(5,0.5,'this is a sin(x) curve',ha='center',va='center')
一定要将文字和图例、标签、标注等组件区别开。
plt.text方法的签名如下:
plt.text(x, y, s, fontdict=None, withdash=False, **kwargs)
下面是常用的参数说明:
- x,y:坐标值,文字放置的位置
- string:文字内容字符串
- size:字体大小
- alpha:设置字体的透明度
- family: 设置字体
- style:设置字体的风格
- wight:字体的粗细
- verticalalignment:垂直对齐方式,缩写为va。可用值
‘center’ | ‘top’ | ‘bottom’ | ‘baseline’。 - horizontalalignment:水平对齐方式 ,缩写为ha。可用值
‘center’ | ‘right’ | ‘left’ - xycoords:选择指定的坐标轴系统
- bbox给标题增加外框 ,常用参数如下:
- boxstyle:方框外形
- facecolor:(简写fc)背景颜色
- edgecolor:(简写ec)边框线条颜色
- edgewidth:边框线条大小
- 其它未列出
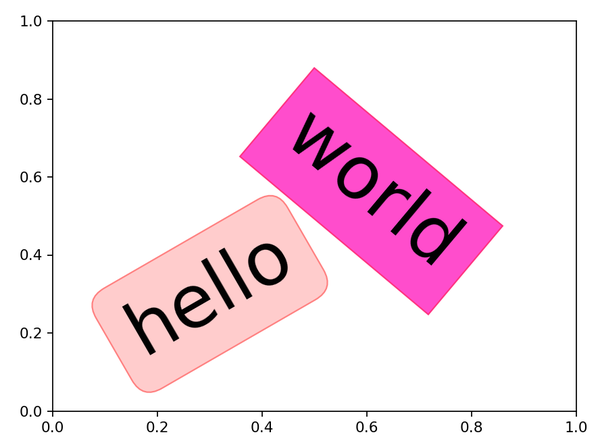
下面是个彩色的例子:
plt.text(0.3, 0.3, "hello", size=50, rotation=30.,ha="center", va="center",bbox=dict(boxstyle="round",ec=(1., 0.5, 0.5),fc=(1., 0.8, 0.8),))
plt.text(0.8, 0.8, "world", size=50, rotation=-40.,ha="right", va="top",bbox=dict(boxstyle="square",ec=(1., 0.2, 0.5),fc=(1., 0.3, 0.8),))
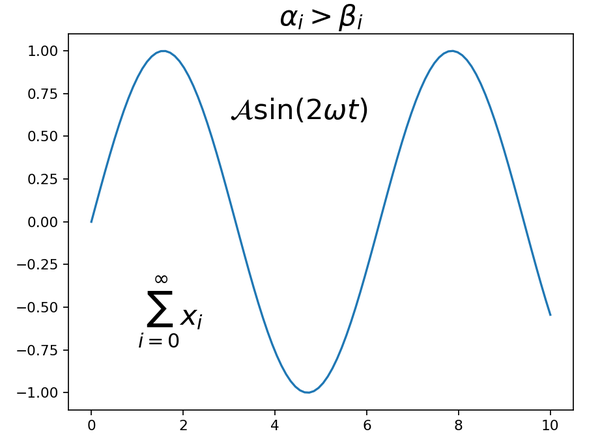
很多时候,文本是以数学公式出现的:
x = np.linspace(0,10,100)
plt.plot(x, np.sin(x))
plt.title(r'$\alpha_i > \beta_i$', fontsize=20)
plt.text(1, -0.6, r'$\sum_{i=0}^\infty x_i$', fontsize=20)
plt.text(3, 0.6, r'$\mathcal{A}\mathrm{sin}(2 \omega t)$',fontsize=20)
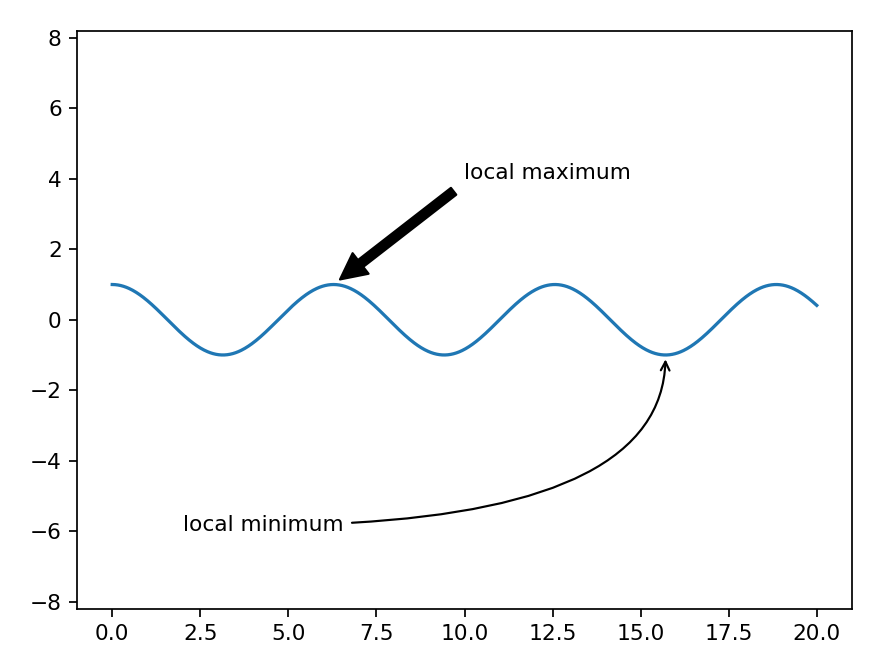
除了文本,简单的箭头也是一种很有用的说明性注释。虽然有一个plt.arrow()方法可以实现箭头的功能,但是由于它生成的是SVG向量对象,会随着图形分辨率的变化而变化,这有可能给我们带来困扰。所以,我们一般使用plt.annotate()方法来实现箭头和注释的功能。下面是其用法演示:
fig, ax = plt.subplots()

x = np.linspace(0, 20, 1000)
ax.plot(x, np.cos(x))
ax.axis('equal')

ax.annotate('local maximum', xy=(6.28, 1), xytext=(10, 4),
            arrowprops=dict(facecolor='black', shrink=0.05))

ax.annotate('local minimum', xy=(5 * np.pi, -1), xytext=(2, -6),
            arrowprops=dict(arrowstyle="->",
                            connectionstyle="angle3,angleA=0,angleB=-90"));
annotate方法的签名如下:
annotate(s='str' ,xy=(x,y) ,xytext=(l1,l2) ,arrowprops=dict(...)..)
主要参数说明:
- s:注释文本内容
- xy:被注释对象的坐标位置,实际上就是图中箭头的箭锋位置
- xytext: 具体注释文字的坐标位置
- xycoords:被注释对象使用的参考坐标系
- extcoords:注释文字的偏移量
- arrowprops:可选,增加注释箭头
下面是一些箭头arrowprops参数的基本配置项:
- width:箭头宽度,以点为单位
- frac:箭头头部所占据的比例
- headwidth:箭头底部的宽度,以点为单位
- shrink:移动提示,并使其离注释点和文本一些距离
**kwargs:matplotlib.patches.Polygon的任何键,例如facecolor
关于箭头的绘制方式,内容实在太多太细,根本无法详解,最好的办法是参考下面两个官方连接:
- https://matplotlib.org/users/annotations.html#plotting-guide-annotation
- https://matplotlib.org/examples/pylab_examples/annotation_demo2.html
这其中的例子,喜欢哪个,复制对应的参数配置方法即可^-^。
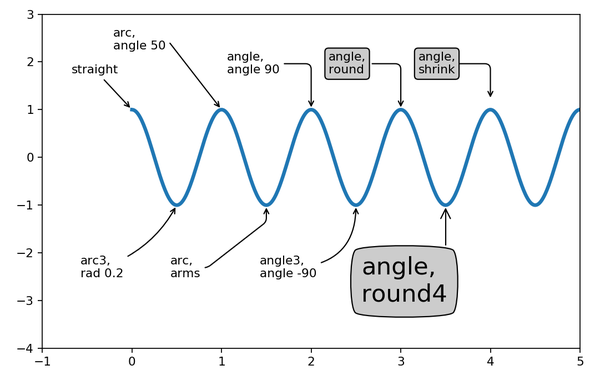
下面是一些具体例子的展示,大家可以对号挑选:
fig = plt.figure(1, figsize=(8, 5))
ax = fig.add_subplot(111, autoscale_on=False, xlim=(-1, 5), ylim=(-4, 3))

t = np.arange(0.0, 5.0, 0.01)
s = np.cos(2*np.pi*t)
line, = ax.plot(t, s, lw=3)

ax.annotate('straight',
            xy=(0, 1), xycoords='data',
            xytext=(-50, 30), textcoords='offset points',
            arrowprops=dict(arrowstyle="->"))

ax.annotate('arc3,\nrad 0.2',
            xy=(0.5, -1), xycoords='data',
            xytext=(-80, -60), textcoords='offset points',
            arrowprops=dict(arrowstyle="->",
                            connectionstyle="arc3,rad=.2"))

ax.annotate('arc,\nangle 50',
            xy=(1., 1), xycoords='data',
            xytext=(-90, 50), textcoords='offset points',
            arrowprops=dict(arrowstyle="->",
                            connectionstyle="arc,angleA=0,armA=50,rad=10"))

ax.annotate('arc,\narms',
            xy=(1.5, -1), xycoords='data',
            xytext=(-80, -60), textcoords='offset points',
            arrowprops=dict(arrowstyle="->",
                            connectionstyle="arc,angleA=0,armA=40,angleB=-90,armB=30,rad=7"))

ax.annotate('angle,\nangle 90',
            xy=(2., 1), xycoords='data',
            xytext=(-70, 30), textcoords='offset points',
            arrowprops=dict(arrowstyle="->",
                            connectionstyle="angle,angleA=0,angleB=90,rad=10"))

ax.annotate('angle3,\nangle -90',
            xy=(2.5, -1), xycoords='data',
            xytext=(-80, -60), textcoords='offset points',
            arrowprops=dict(arrowstyle="->",
                            connectionstyle="angle3,angleA=0,angleB=-90"))

ax.annotate('angle,\nround',
            xy=(3., 1), xycoords='data',
            xytext=(-60, 30), textcoords='offset points',
            bbox=dict(boxstyle="round", fc="0.8"),
            arrowprops=dict(arrowstyle="->",
                            connectionstyle="angle,angleA=0,angleB=90,rad=10"))

ax.annotate('angle,\nround4',
            xy=(3.5, -1), xycoords='data',
            xytext=(-70, -80), textcoords='offset points',
            size=20,
            bbox=dict(boxstyle="round4,pad=.5", fc="0.8"),
            arrowprops=dict(arrowstyle="->",
                            connectionstyle="angle,angleA=0,angleB=-90,rad=10"))

ax.annotate('angle,\nshrink',
            xy=(4., 1), xycoords='data',
            xytext=(-60, 30), textcoords='offset points',
            bbox=dict(boxstyle="round", fc="0.8"),
            arrowprops=dict(arrowstyle="->",
                            shrinkA=0, shrinkB=10,
                            connectionstyle="angle,angleA=0,angleB=90,rad=10"))
参数textcoords少写个t
latex语法: \mathcal{A}表示A为花体,\mathrm{sin}表示sin由数学斜体变为正体