Python数据分析
Anaconda发行版
Jupyter notebook
安装和文档
启动
运行机制
主界面
新建文档
工作界面
文档结构
编辑和命令模式
快捷键
执行和输出
Markdown单元
图片和视频
幻灯片
导出格式
魔法命令
Numpy
基础知识
数据类型
创建数组
数组运算
通用函数
索引切片迭代
添加删除去重
形状变换
堆积数组
分割数组
视图和复制
广播机制
花式索引
布尔索引
统计方法
随机数
Pandas
Series
DataFrame
Index
重建索引
轴向上删除条目
索引和切片
算术和广播
函数和映射
排序和排名
统计和汇总
文件读取
分块读取
写出数据
JSON和Pickle
HDF5
EXCEL文件
Web交互
数据库交互
删除缺失值
补全缺失值
删除重复值
替换
重命名轴索引
离散化和分箱
检测和过滤
随机和抽样
字符串操作
分层索引
分层索引进阶
合并连接
粘合与堆叠
重塑
Matplotlib
配置环境
使用常识
保存图形
两种图画接口
使用中文
线型图
颜色线型和标记
坐标轴上下限
坐标轴刻度
图题、轴标签和图例
配置图题
配置图例
颜色条
文本、箭头和注释
散点图
直方图
条形图
饼图
误差线
等高线
多子图
patch
自定义坐标轴刻度
风格样式展示
下一步
自定义坐标轴刻度
阅读: 4105 评论:0Matplotlib图形对象具有层级关系。Figure对象其实就是一个盛放图形元素的盒子box,每个figure都会包含一个或多个axes对象,而每个axes对象又会包含其它表示图形内容的对象,比如xais和yaxis,也就是x轴和y轴。
- 主要刻度和次要刻度
每个坐标轴都有主要刻度和次要刻度,主要刻度往往更大或者突出显示,而次要刻度往往更小,一般不直接显示。
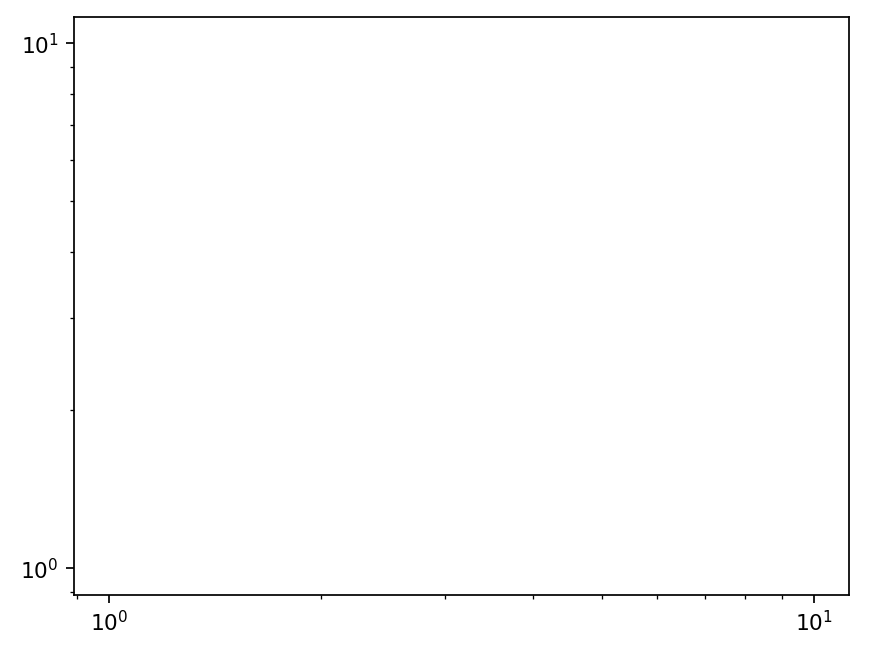
下面是一个对数坐标轴,可以看到次要刻度:
ax = plt.axes(xscale='log', yscale='log')
我们发现每个主要刻度都显示未一个较大的刻度线和标签,而次要刻度都显示为一个较小的刻度线,并且不现实标签。
每种刻度线都包含一个坐标轴定位器(locator)和格式生成器(formatter),可以通过下面的方法查看:
>>> ax.xaxis.get_major_locator()
<matplotlib.ticker.LogLocator at 0x276ff49db38>
>>> ax.xaxis.get_major_formatter()
<matplotlib.ticker.LogFormatterSciNotation at 0x276ff49d978>

>>> ax.xaxis.get_minor_locator()
<matplotlib.ticker.LogLocator at 0x276ff49d940>
>>> ax.xaxis.get_minor_formatter()
<matplotlib.ticker.LogFormatterSciNotation at 0x276ff493320>
我们可以发现,针对x或y轴,针对主要和次要,针对定位器和格式器,分别有不同的对象来处理。
- 隐藏刻度与标签
如果我们想隐藏刻度或标签,就要着落在locator和formatter这两大属性上了:
ax = plt.axes()
x = np.linspace(0,10,100)
ax.plot(np.sin(x))

ax.yaxis.set_major_locator(plt.NullLocator())
ax.xaxis.set_major_formatter(plt.NullFormatter())
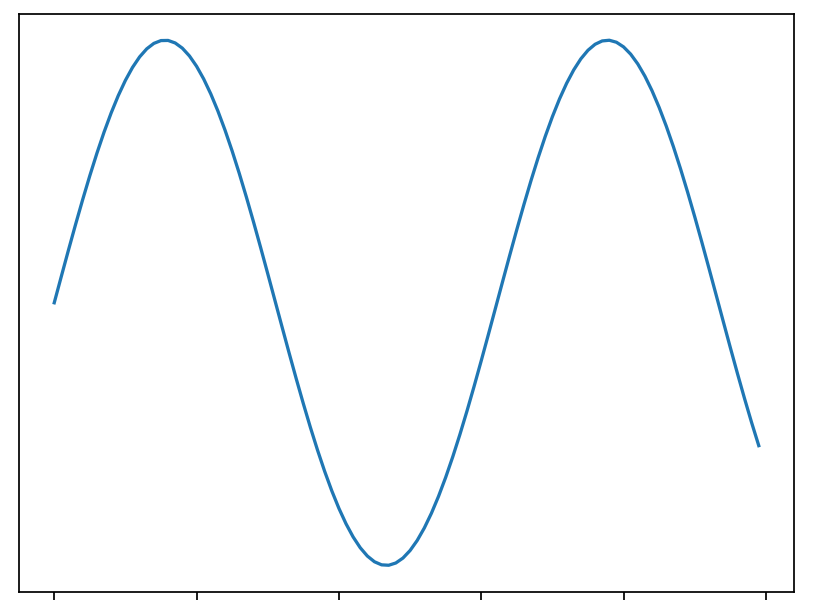
可以看出,没有locator,刻度和标签都会被隐藏起来;没有formatter,隐藏标签,但刻度还存在。
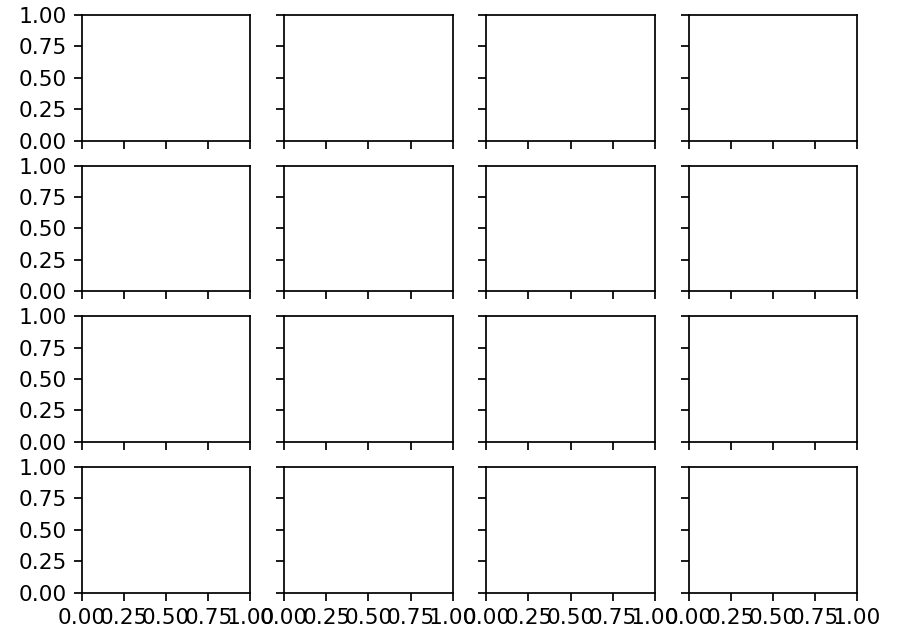
- 设置刻度数量
默认情况下,matplotlib会自动帮我们调节刻度的数量,但有时候也需要我们自定义刻度数量:
fig, ax = plt.subplots(4, 4, sharex=True, sharey=True)
for axi in ax.flat:
    axi.xaxis.set_major_locator(plt.MaxNLocator(4))
    axi.yaxis.set_major_locator(plt.MaxNLocator(4))